The View-As-Colour tool allows you to see at a glance the values of any of the parameters for a majority of the object types. This is a very powerful tool for model checking. Here are some examples.
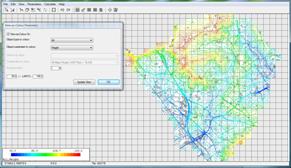 |
Heights
This provides an overview of the topography of an area. This can be used to check very easily whether the height data imported or entered is correct. It will also show any dramatic differences in heights of neighbouring objects, which can indicate errors. |
 |
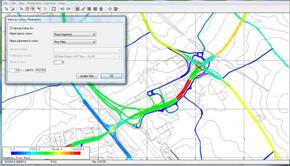
Road Heights
One of the ways this can be used is to show what is happening with the road heights at split level junctions, checks can be made to ensure that the correct road segments go above or below each other. The changes in colour make this very easy to see. |
 |
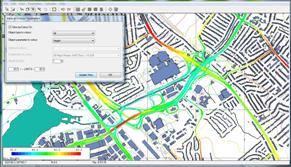
Traffic Flows
The view-as-colour tool can be used to examine any parameter of any object type. One of the most useful is for checking the traffic flows assigned to the roads. The change from red to green in this example is where the road changes from dual to seperate carriageways. |
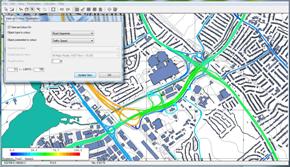 |
Traffic Speeds
Another common example is looking at traffic speeds, the thematic viewing makes it very easy to see at a glance whether any errors have crept in from the input data. |